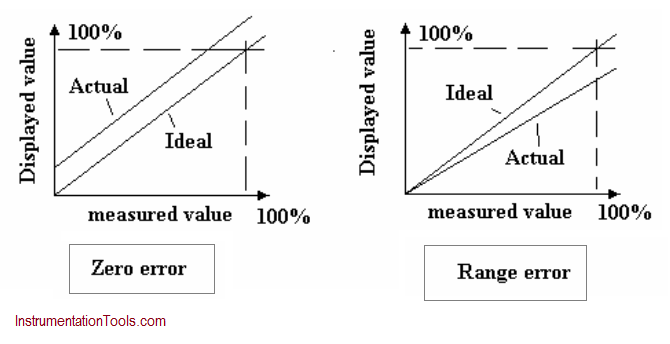
After obtaining correct zero and range for the instrument, a calibration graph should be produced. This involves plotting the indicated reading against the correct reading from the standard gauge.
This should be done in about ten steps with increasing signals and then with reducing signals. Several forms of error could show up.
If the zero or range is still incorrect the error will appear as shown.
Range and Zero Error
