In the earlier days, the cycle of valve manufacturing used to undergo a long process, industries used to manufacture the valve and send them to the lab for the experimental flow loop testing. After a month of the testing process, the results were sent to the valve manufacturer, if the experimental results are as expected by the end-user then the design is acceptable and if it fails to fulfill the end-user requirement then the whole cycle repeats again where it would be a great loss of time and money. The platform provided by the simulationHub’s Autonomous Valve CFD app takes care of CFD expertise for simulating a valve according to the standard lab testing procedure and provides the results before manufacturing the valve by just using the CAD geometry of the valve. The Autonomous Valve CFD app provides good flow insights that can be helpful for the design engineers to improve their valve designs before the prototype.
With the help of Autonomous Valve CFD results, the design engineers can quickly develop multiple designs that help in the analysis of the design iterations and choose the optimal solution
simulationHub’s Autonomous Valve CFD app understands the need for better visualization and post-processing techniques which helps the valve designers to get insights into the flow behavior at each and every opening condition in the form of velocity and pressure. By using these results valve designers can improve their valve designs to achieve target performance requirements. Let’s see what are the visualization techniques provided by the Autonomous Valve CFD app.
What are the results provided by the AVC application?
- FLowlines
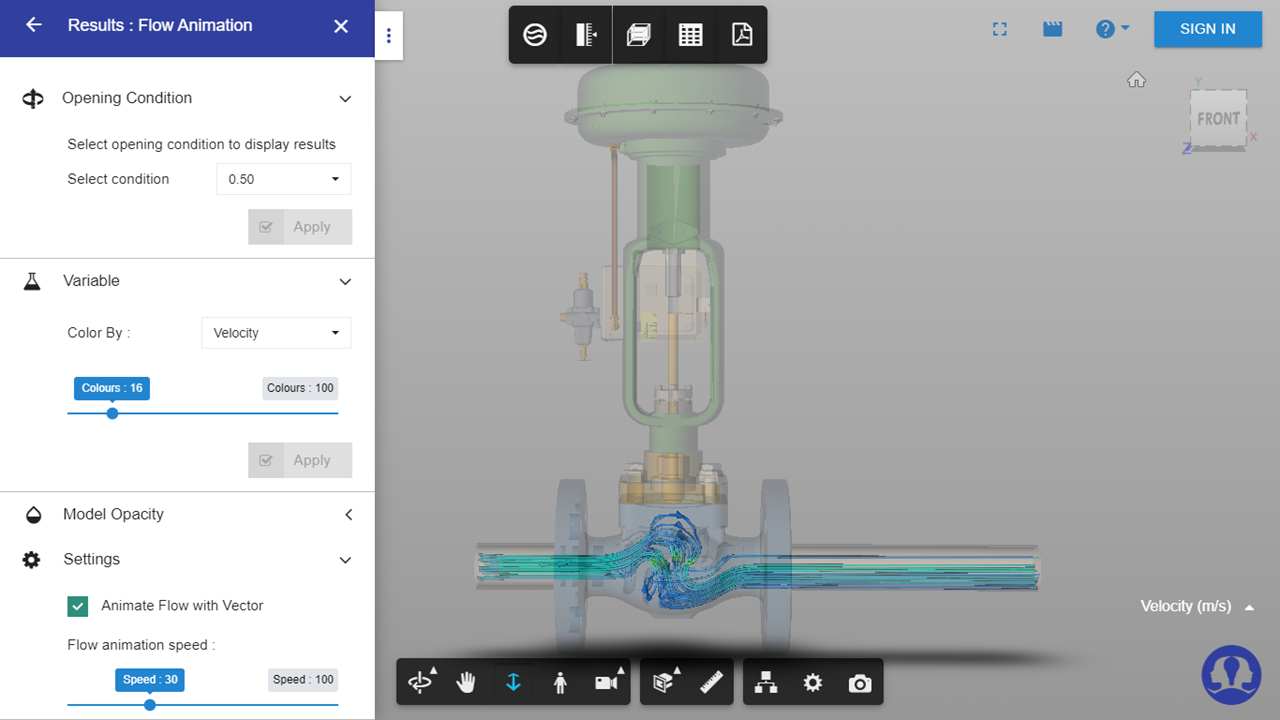
Flow lines represent the path followed by fluid particles from an inlet to the outlet of a valve. The animated arrows on the flowlines indicate the direction of velocity vectors at that point and speed is based on the magnitude of velocity. This is similar to the flow visualization technique where some colored particles are injected from an inlet and its trace in the flow domain is marked. Along with that path, the flow lines also display the magnitude of velocity and pressure of each particle along its path. This is useful information to identify flow separation and recirculation zones in a valve.
- Surface pressure
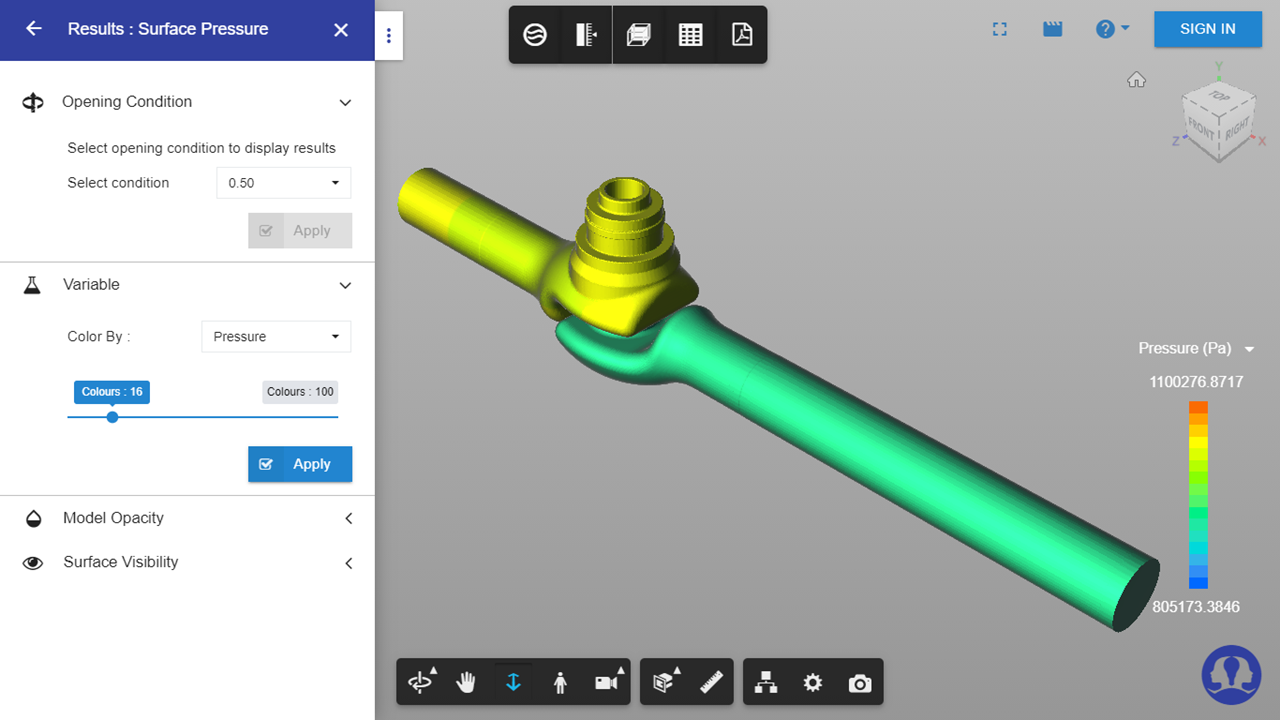
Surface pressure is pressure contours plotted on the surfaces in contact with the fluid. This information is useful to identify the regions of low-pressure zones and the possible locations of flow recirculation.
- Contour plots
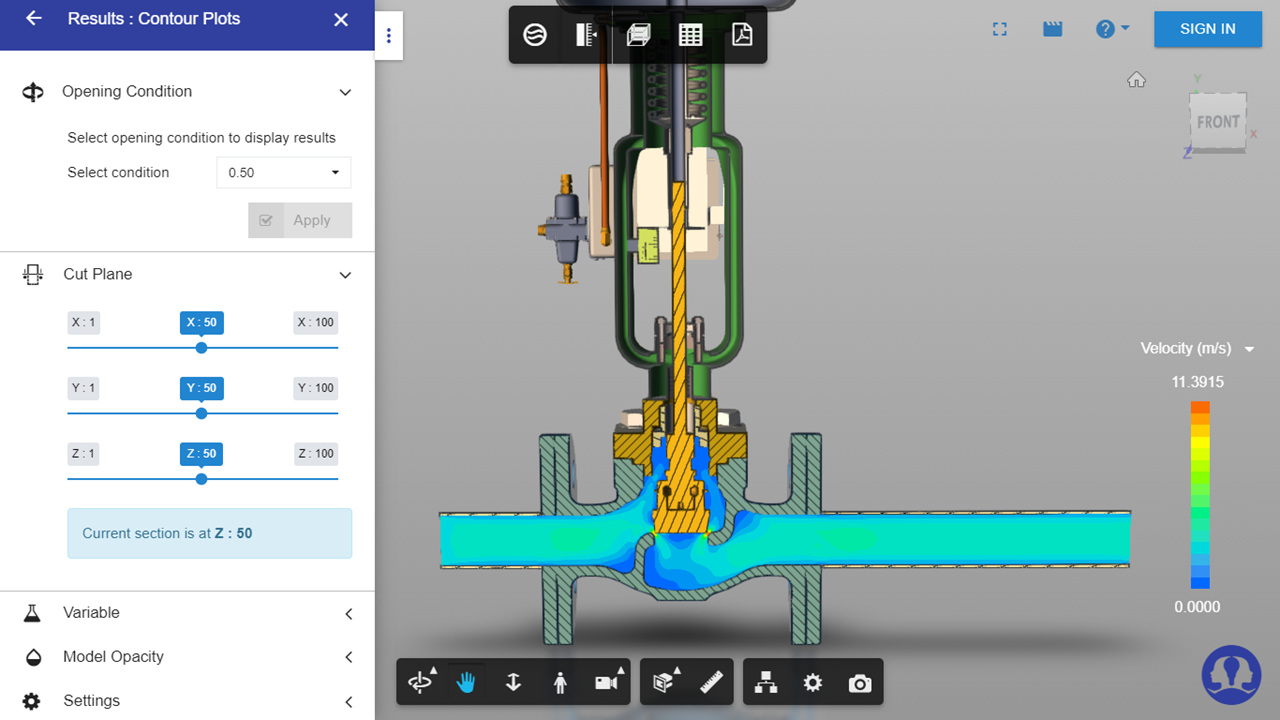
The contour plot is a pictorial representation of flow property variation in the fluid domain. The location of flow separation, high velocity, and low-pressure regions are a few examples of insights that can be gained through CFD results visualization. Contour plots display the velocity or pressure variation about any 2D cut section of the geometry.
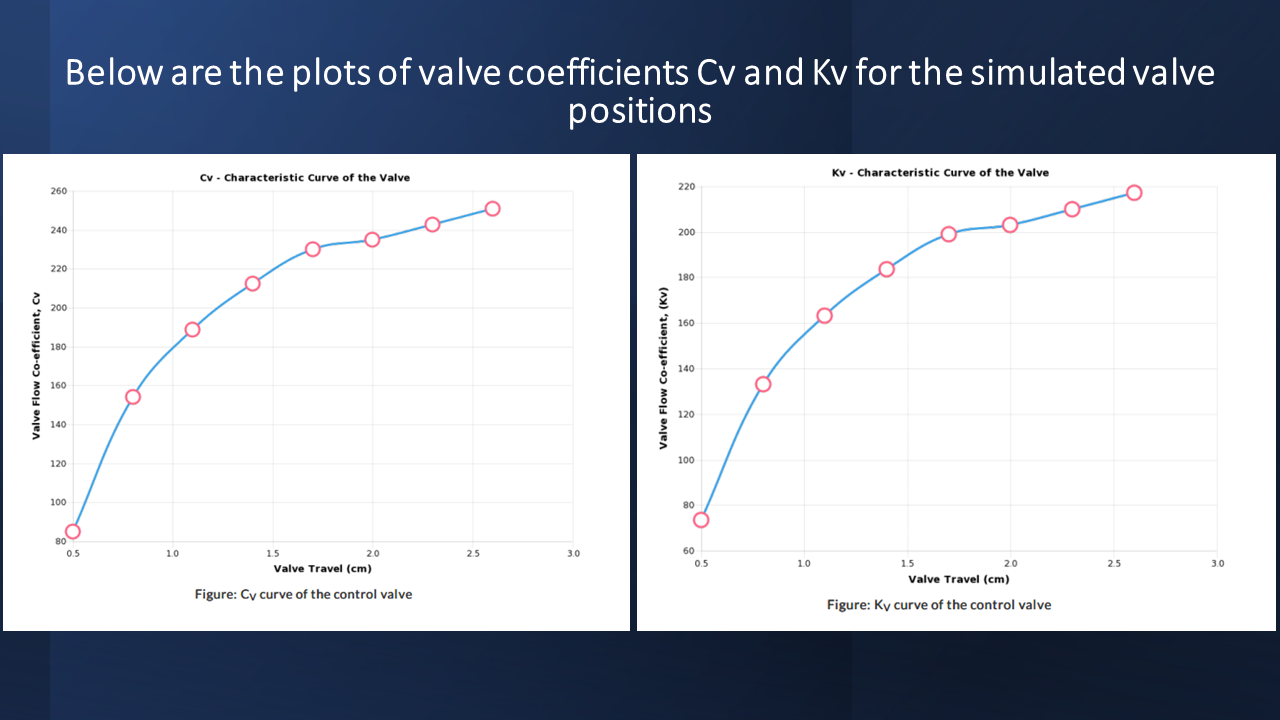
- Performance data and valve characteristic curves
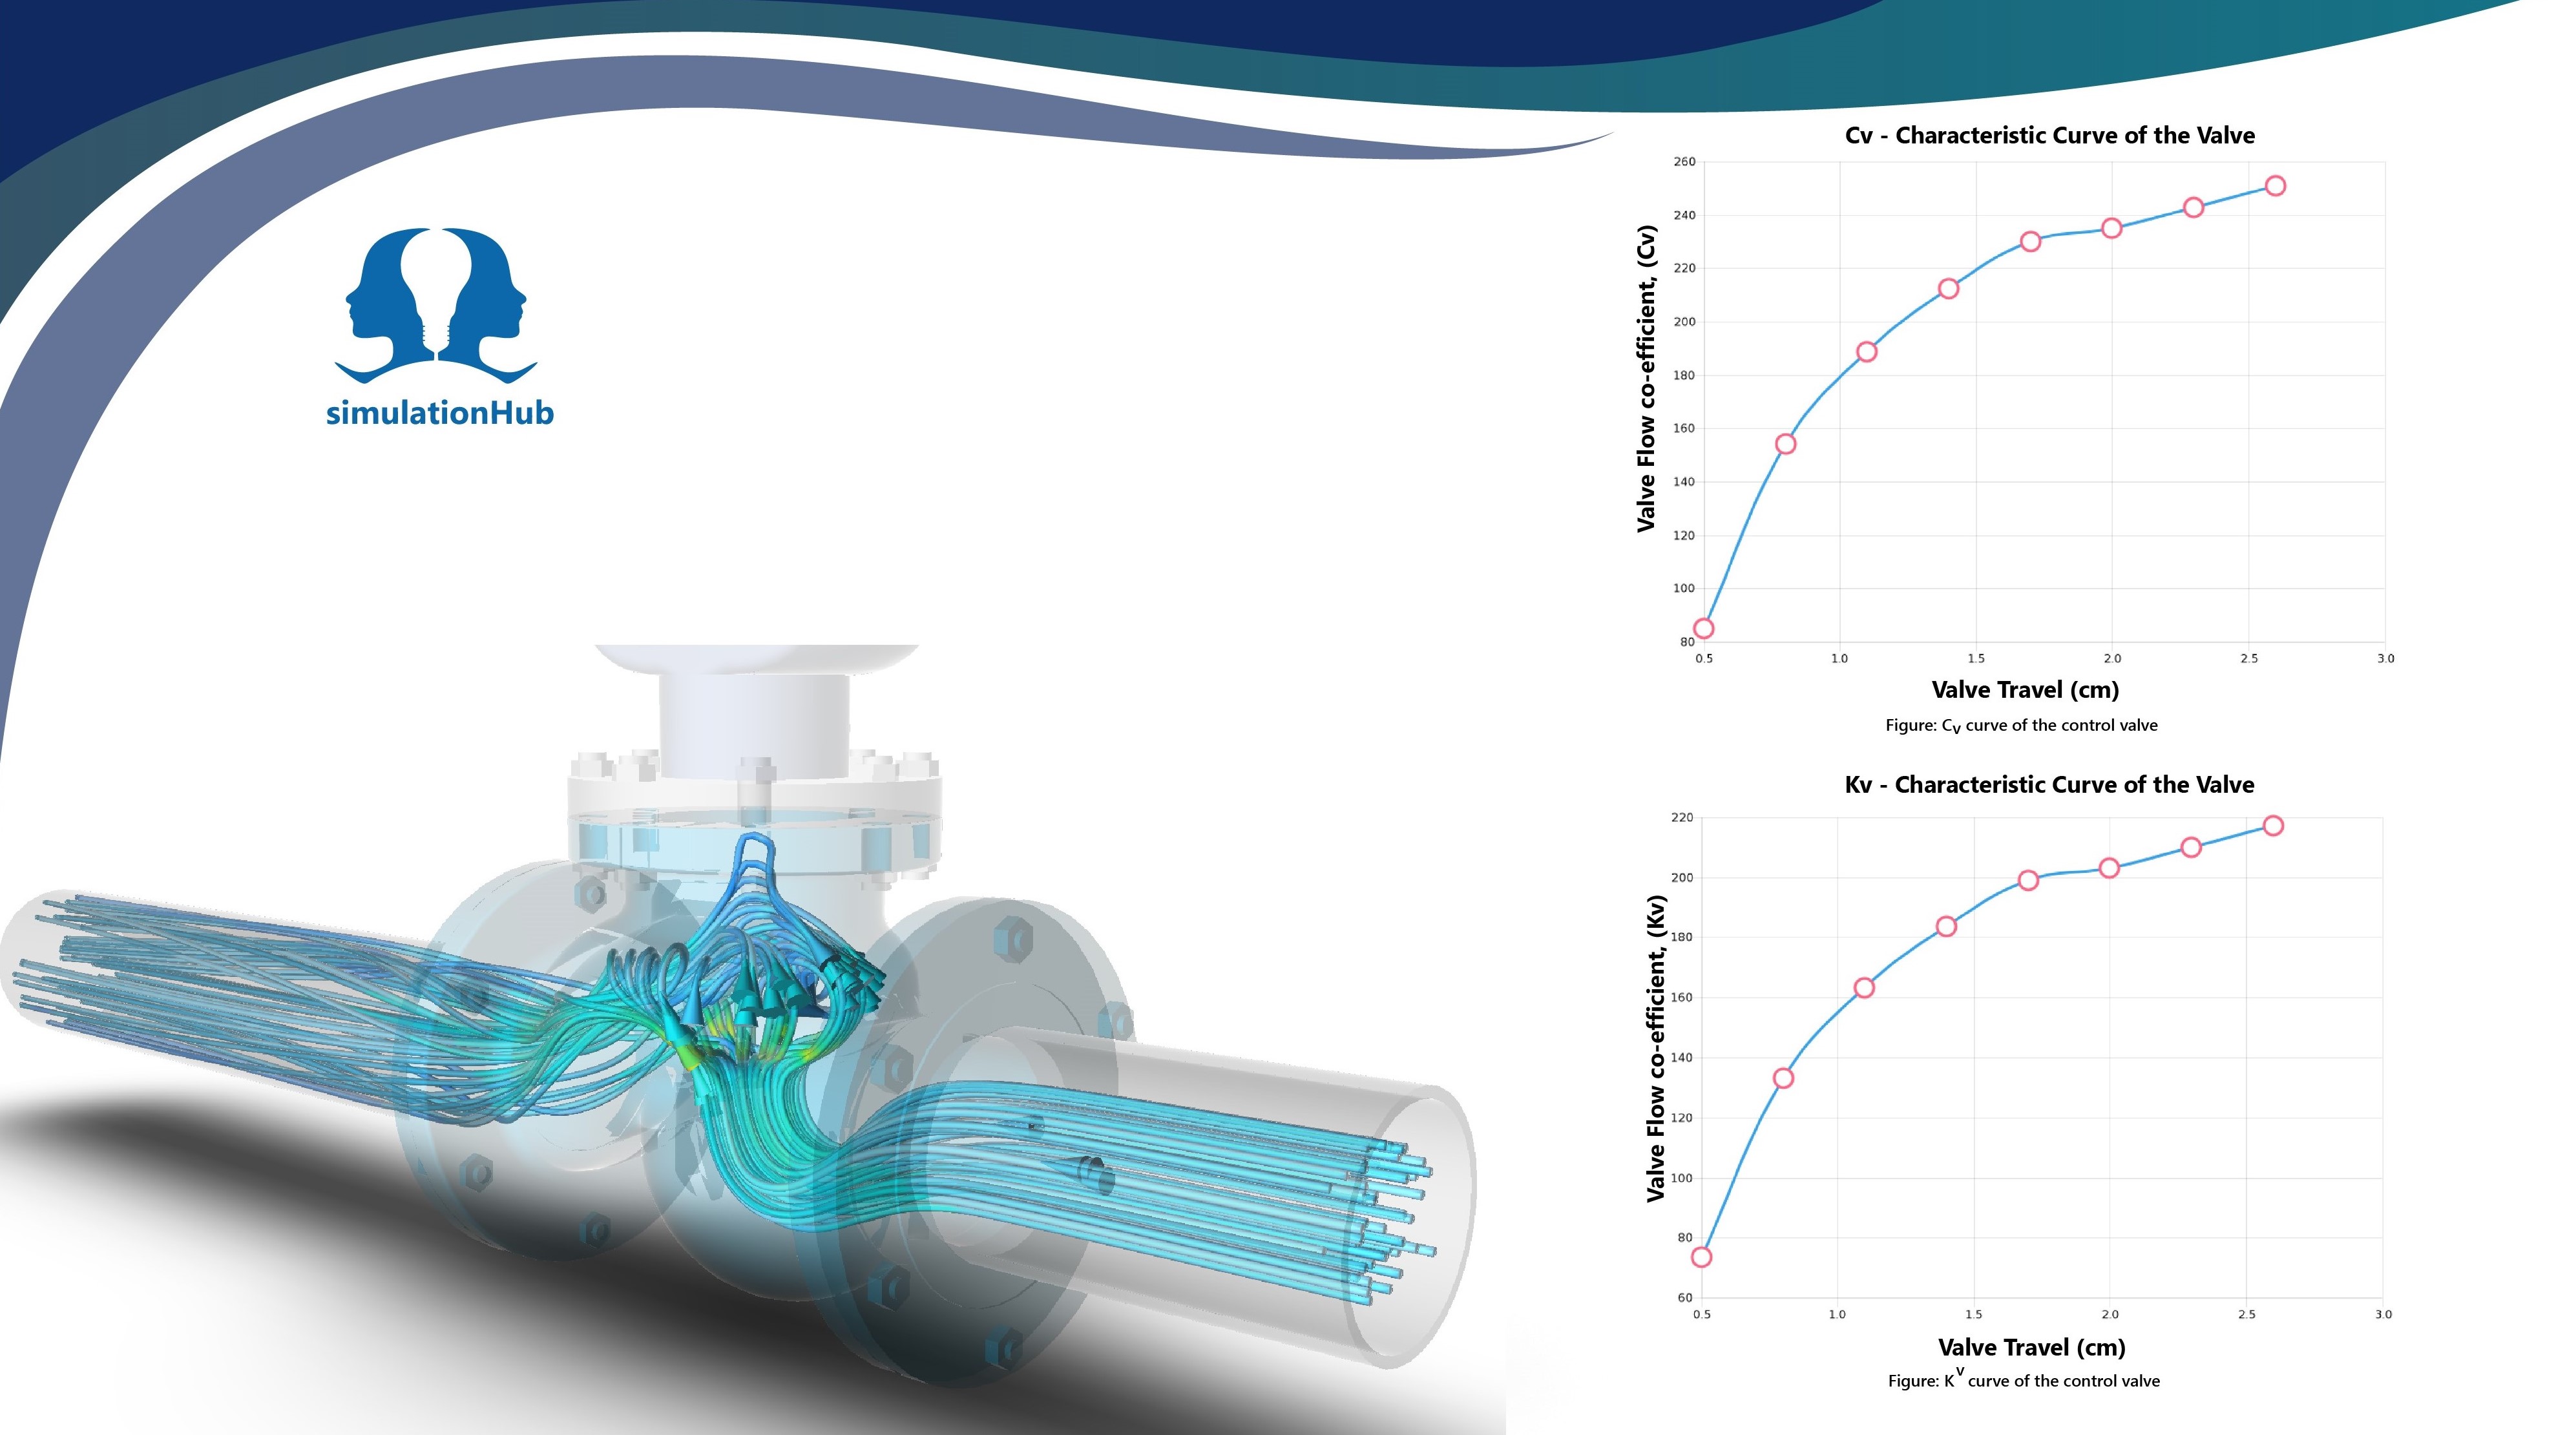
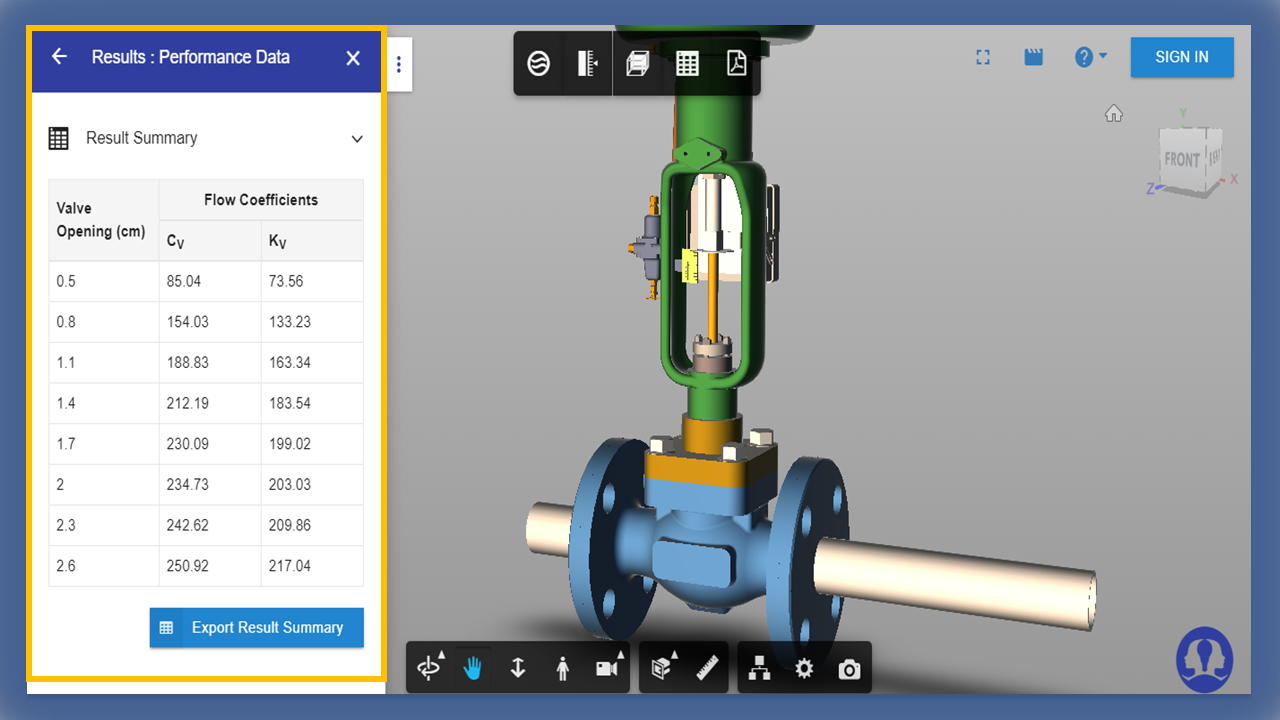
Autonomous Valve CFD app generates various valve performance data including valve coefficients like Cv, Kv and Cdt at various opening conditions. Flow performance coefficients (Cv, Kv) are determined based on the procedures prescribed by the IEC & ANSI standards. The Cv value is calculated as a function of both the line flow rate and the pressure drop across the valve. The app provides valve flow performance coefficients in both Gross as well as Net values.
One of the basic requirements in valve technology is the flow loop testing of the valves. The valve flow coefficient is important for the end-user to select the valves for process applications. In this process of flow loop testing Autonomous Valve, CFD software helps the valve manufacturer to get the accurate results of Cv, Kv, Cdt values.
Valve Flow Coefficient (Cv) is a valve’s capacity for a liquid or gas to flow through it. It is technically defined as “the volume of water at 60°F (in US gallons) that will flow through a valve per minute with a pressure drop of 1 psi across the valve
Kv is the flow coefficient in metric units. It is defined as the flow rate in cubic meters per hour [m3/h] of water at a temperature of 16º celsius with a pressure drop across the valve of 1 bar.
- Valve Performance Report
The Autonomous Valve CFD app comes with a unique report generation feature. We have extracted required and critical information about analysis to compile a ready-to-use PDF report.
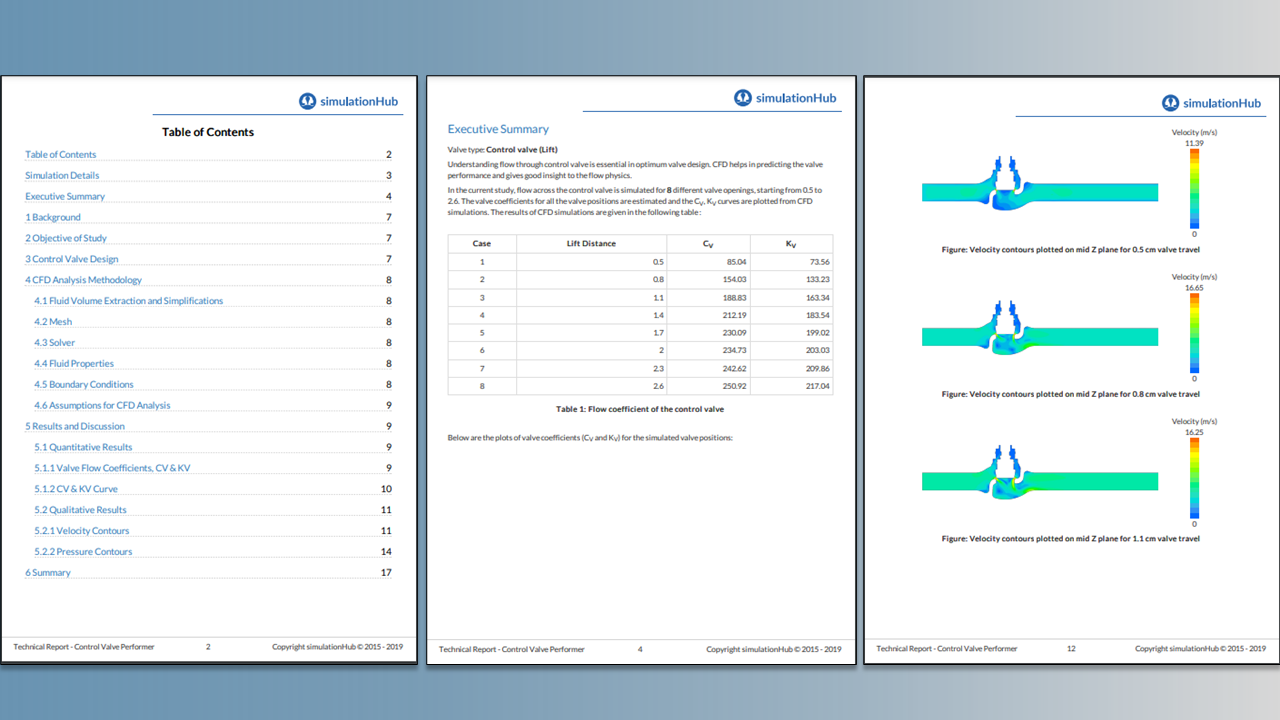
The results generated using Autonomous Valve CFD app helps the manufacturers to directly share it with their customers. The valve manufacturers can also publish this report on their respective websites for more transparency between their end-users and for easy reachability. This helps valve authorities to get recognized by their valuable customers. As the app is cloud-based multiple users can access the application. The user need not have to download CFD simulation files to view the results as all the post process has been automated. The result so generated by the app can be accessed from any location using the devices like phones, tab, desktops.
To know more about simulationHub’s Autonomous Valve CFD app:
- Start your 15 days trial period today and start simulating your valve design.
- View case studies of how simulationHub apps are used for product design and optimization.
Contact: [email protected]