Principle of operation of plethysmograph depends on Boyle‟s law. Boyle‟s law states that at a given Kelvin temperature the pressure of given mass of the gas is inversely proportional to its volume.
(P* Vol = K* temp).
1 Like
To derive a relation between PPG and BP signals, it’s crucial to understand the elastic property of blood vessels and how blood volume changes with blood pressure. Blood vessel wall is anisotropic
in structure that has highly nonlinear elastic properties, thus a simple Hookean model doesn’t apply here. Langewouters etal derived a relationship between BP in the human finger and the change in the arterial radius. However, the expression was complicated, and has limited success in BP estimation applications.
In this paper, we will adopt a simpler formula to establish the relation between the two.
The arterial wall stress is generally born by collagen, elastin and smooth muscle. Their combined dynamic Young’s modulus of elasticity (E) determines the stiffness of blood vessels. A number of in vitro studies have been carried out to estimate the relationship between E and the transmural pressure ( P).
One widely used empirical formula was given by Hughes et al
E = E0eγP
E0 and γ depend on the site of measurement and upon the particular animal. For example, γ measured in canine aorta is 0.017 ± 0.004 mm Hg−1. Bergel et al and Peterson et al used different
approaches to calculate E, which can be simplified approximately to
E=(1−σ2)×r2h×dPdr
Here, σ is Poisson’s ratio and is typically treated as a constant. In some previous studies, σ was assumed to be 0.5, which treated E as incremental modulus. Since we only care about the circumferential stress, E was chosen to represent the “tension-strain modulus” and σ was set to 0. Note that the choice of σ doesn’t affect the general conclusion drawn in the next section. h represents the thickness of the blood vessel wall, and r represents the mean radius of the blood vessel.
Interpretation of PPG signal
To simplify our model, we assume PPG signal correlates linearly with the blood volume (V) in the fingertip, and arterial blood vessels in the finger vascular bed have a uniform radius r, so that V in the measured area can be written as
V = Cπr2 + V0 (3)
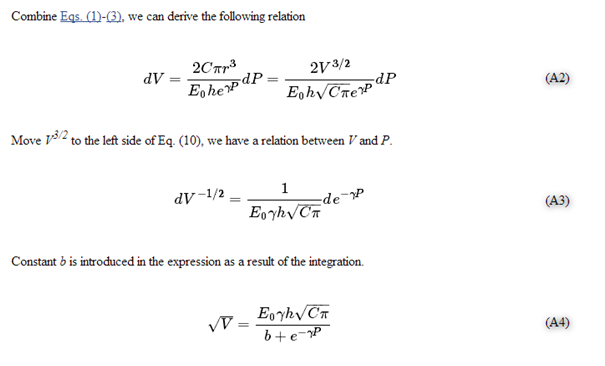
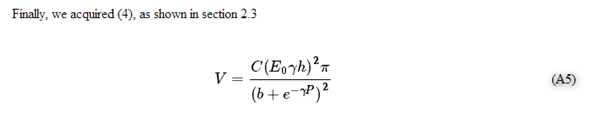
Here C is a constant related to arterial blood vessel density, and V0 is related to microvascular and venous blood volume. Suppose V0 doesn’t pulsate, and combine Eqs. (1)-(3), we can derive the following relation
V=C(E0γh)2π(b+e−γP)2 (4)
Here b is a large constant introduced by integration, and is assumed to be independent of E0, γ and h. V can be roughly approximated to the first order as
V≈C(E0γh)2πb2(1−2be−γP) (5)
The normalized PPG signal is then formulated as
PPGnorm=V−VminVmin=2(e−γPmin−e−γP)b−2e−γPmin (6)
The time variant component of V is typically only a few percentage of the stationary component, which meansPPGnorm is very small. To help visualize the pulse waveforms, a linear scaling function is typically used to amplify and shift the normalized PPG signal. This scaling function varies from manufacturer to manufacturer. In this study, we used ks as the scaling factor and Voff as the offset factor. Since b is very large, a modified scaling
factor k is used to simplify the calculation. k is very important to proper
normalization of PPG signal across patients.
PPGscaled = ks × PPGnorm + Voff ≈ k(e−γPmin − e−γP) + Voff (7)
Advantages and limitations
Before normalization, PPG signal is heavily influenced by blood vessel elastic properties E and blood volume Vetc, which have large person to person variation. It’s difficult to derive a general rule that applies to all people. After normalization, PPG signals taken from different subjects
become comparable, assuming similar vascular composition. Normalization also ameliorated the effect of non-ideal contact between sensors and the finger, such as off-center placement, since DC component and AC component change almost proportionally. γ may still have a small variation among different population, but the influence is comparatively small.
However, because of the assumptions used in our derivation, there are limitations to this method. One important assumption is that the blood constituent ratio will remain constant during the entire course of measurement, especially those having high absorption abilities at NIR wavelength such as haemoglobin, which is true for most people including hypertensive patients. But in certain cases where a patient undergoes hemodynamic fluctuation, such as serious edema or blood clot, this method could fail and needs to be used with discretion.
Secondly, arterial vascular structure in the finger is far from uniform, which gives a distribution of vessel diameters. We only did approximation to the second order, which may introduce considerable error when more accurate results are desired. Also, different vascular composition causes different background absorption ratio, which leads to a variation of b. Thus the BP fitting error will be relatively large if only amplitude information is used. That’s why we also have to combine with shape information of the waveforms, which is indirectly influenced by the BP level, to improve BP fitting accuracy.
Thirdly, we haven’t considered the light absorption from nonvascular soft tissue, pulsation from venous and the mild pressure exerted by the PPG sensor. Last but not the least, our theory is based on Eqs. (1)-(2), which describe the property of arota and its major branches fairly well, but may lose its accuracy when applied to blood vessels in finger tips. But fortunately, thanks to the use of neural network as opposed to straight forward regression, some of these adverse effects can be overcome quite effectively in practice with the extensive training of the network.
Here, we derive the expressions for
blood volume (V) as a function of blood pressure §. Derivation is firstly done on both sides of Eq. (3).
dV = 2Cπrdr (A1)
We can derive following relation
4 Likes